Estimating guide · section 23 of 29
Read the pipeline
See the value of the work in hand, how much is won, the hit rate and why work is lost.
Watch this in the video (2:11)
Steps
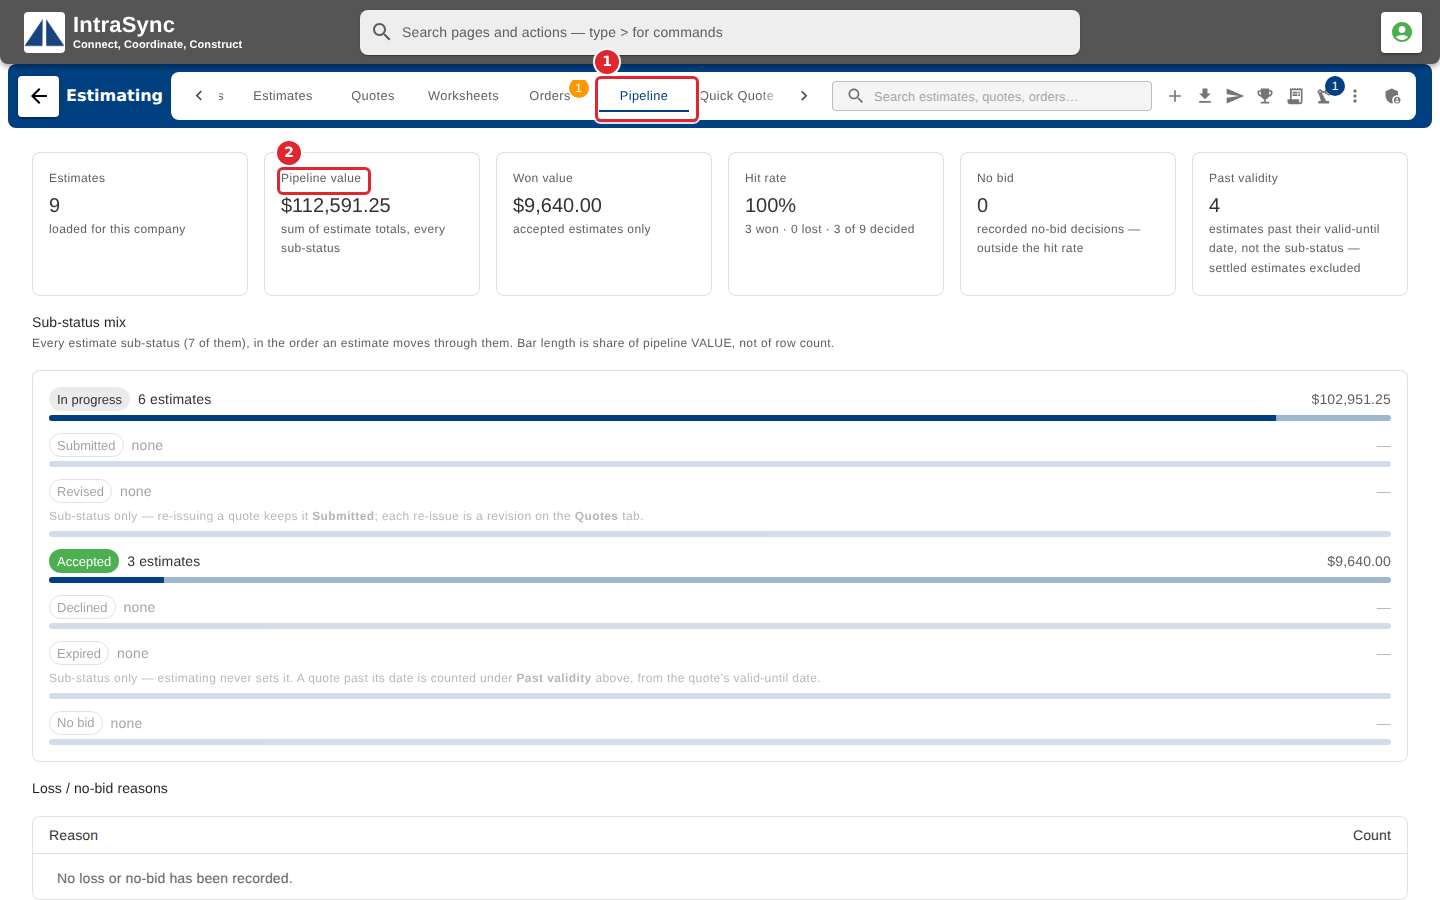
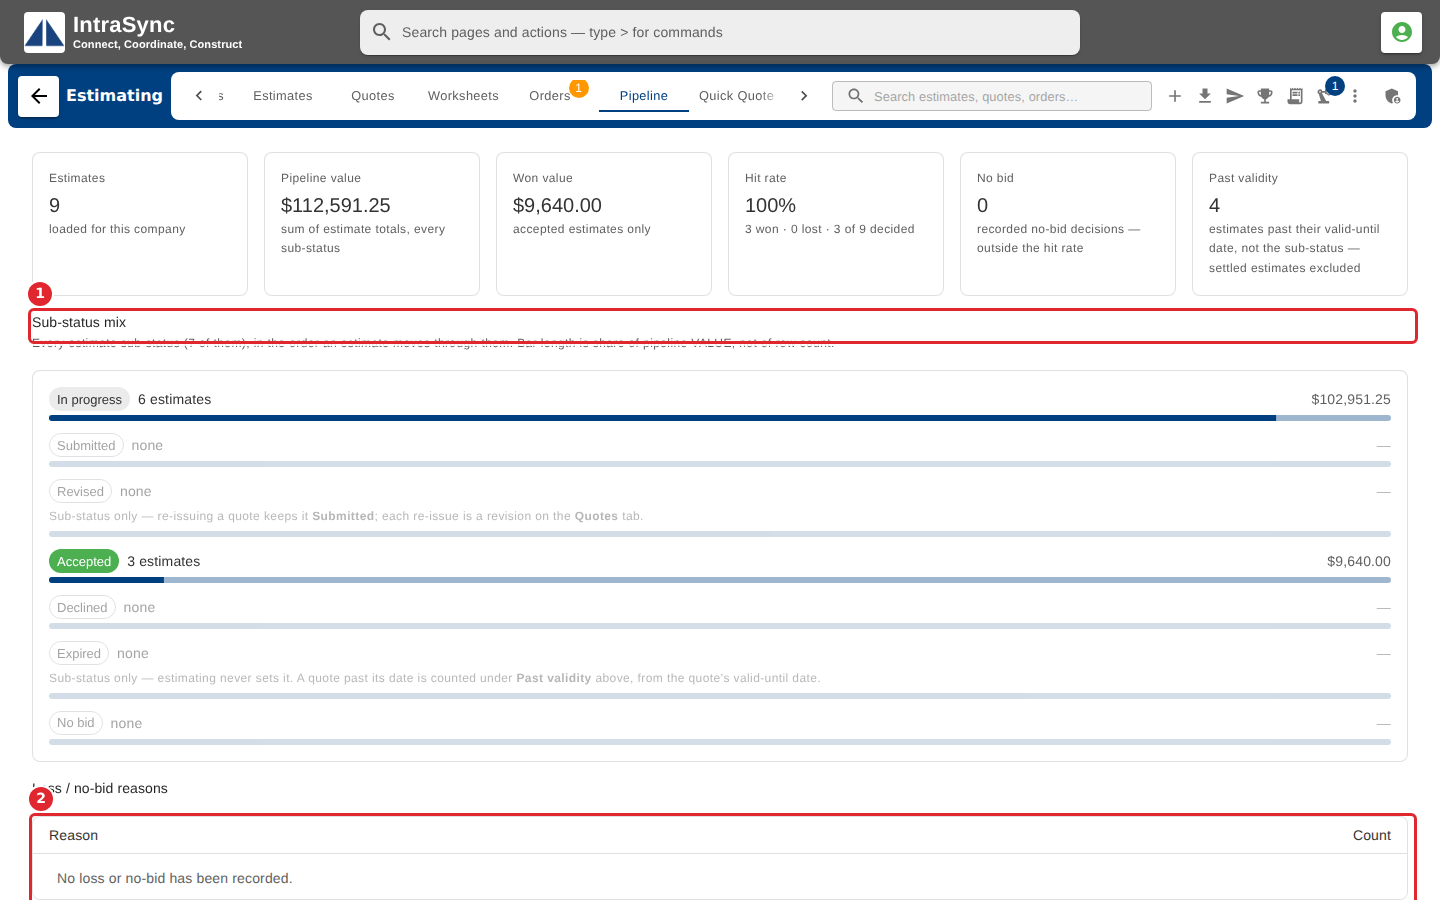
In the pictures, a numbered red box marks where to click or type. Where a picture has more than one box, the numbers give the order.
Select the Pipeline tab. The tiles across the top give the pipeline value, the won value, the hit rate, the no-bids and the estimates past their validity.
Sub-status mix shows how many estimates sit at each status and their share of the pipeline's value. Loss / no-bid reasons counts the reasons recorded with each loss.
Tips
- The hit rate counts wins and losses only. No-bids are shown on their own tile, outside it.
- Estimating never sets Expired itself: a quote past its date is counted under Past validity. Re-issuing a quote keeps the estimate Submitted; each re-issue is a revision on the Quotes tab.
- Amounts in different currencies are shown per currency, never added together.